Posted on 2025-02-16 · 2 min read · Twenty Five · Stats · R · Blogging · Charts
Here are some more stats about the blog after I ran out of time yesterday due to data cleaning! This time I’ve taken the date of each post and extracted the month and year. Then I added the number of posts in each month and the number of words written. I had to left join on the complete time span between August 2010 and February 2025, filling in any NA values for the zeros that were missing before I did that.
And why do I want the zeros? Because it’s time for box plots! Then I can see whether this January is an outlier (spoiler alert: it is!) compared to the other Januarys I’ve been blogging, in terms of both posts written and total words written.
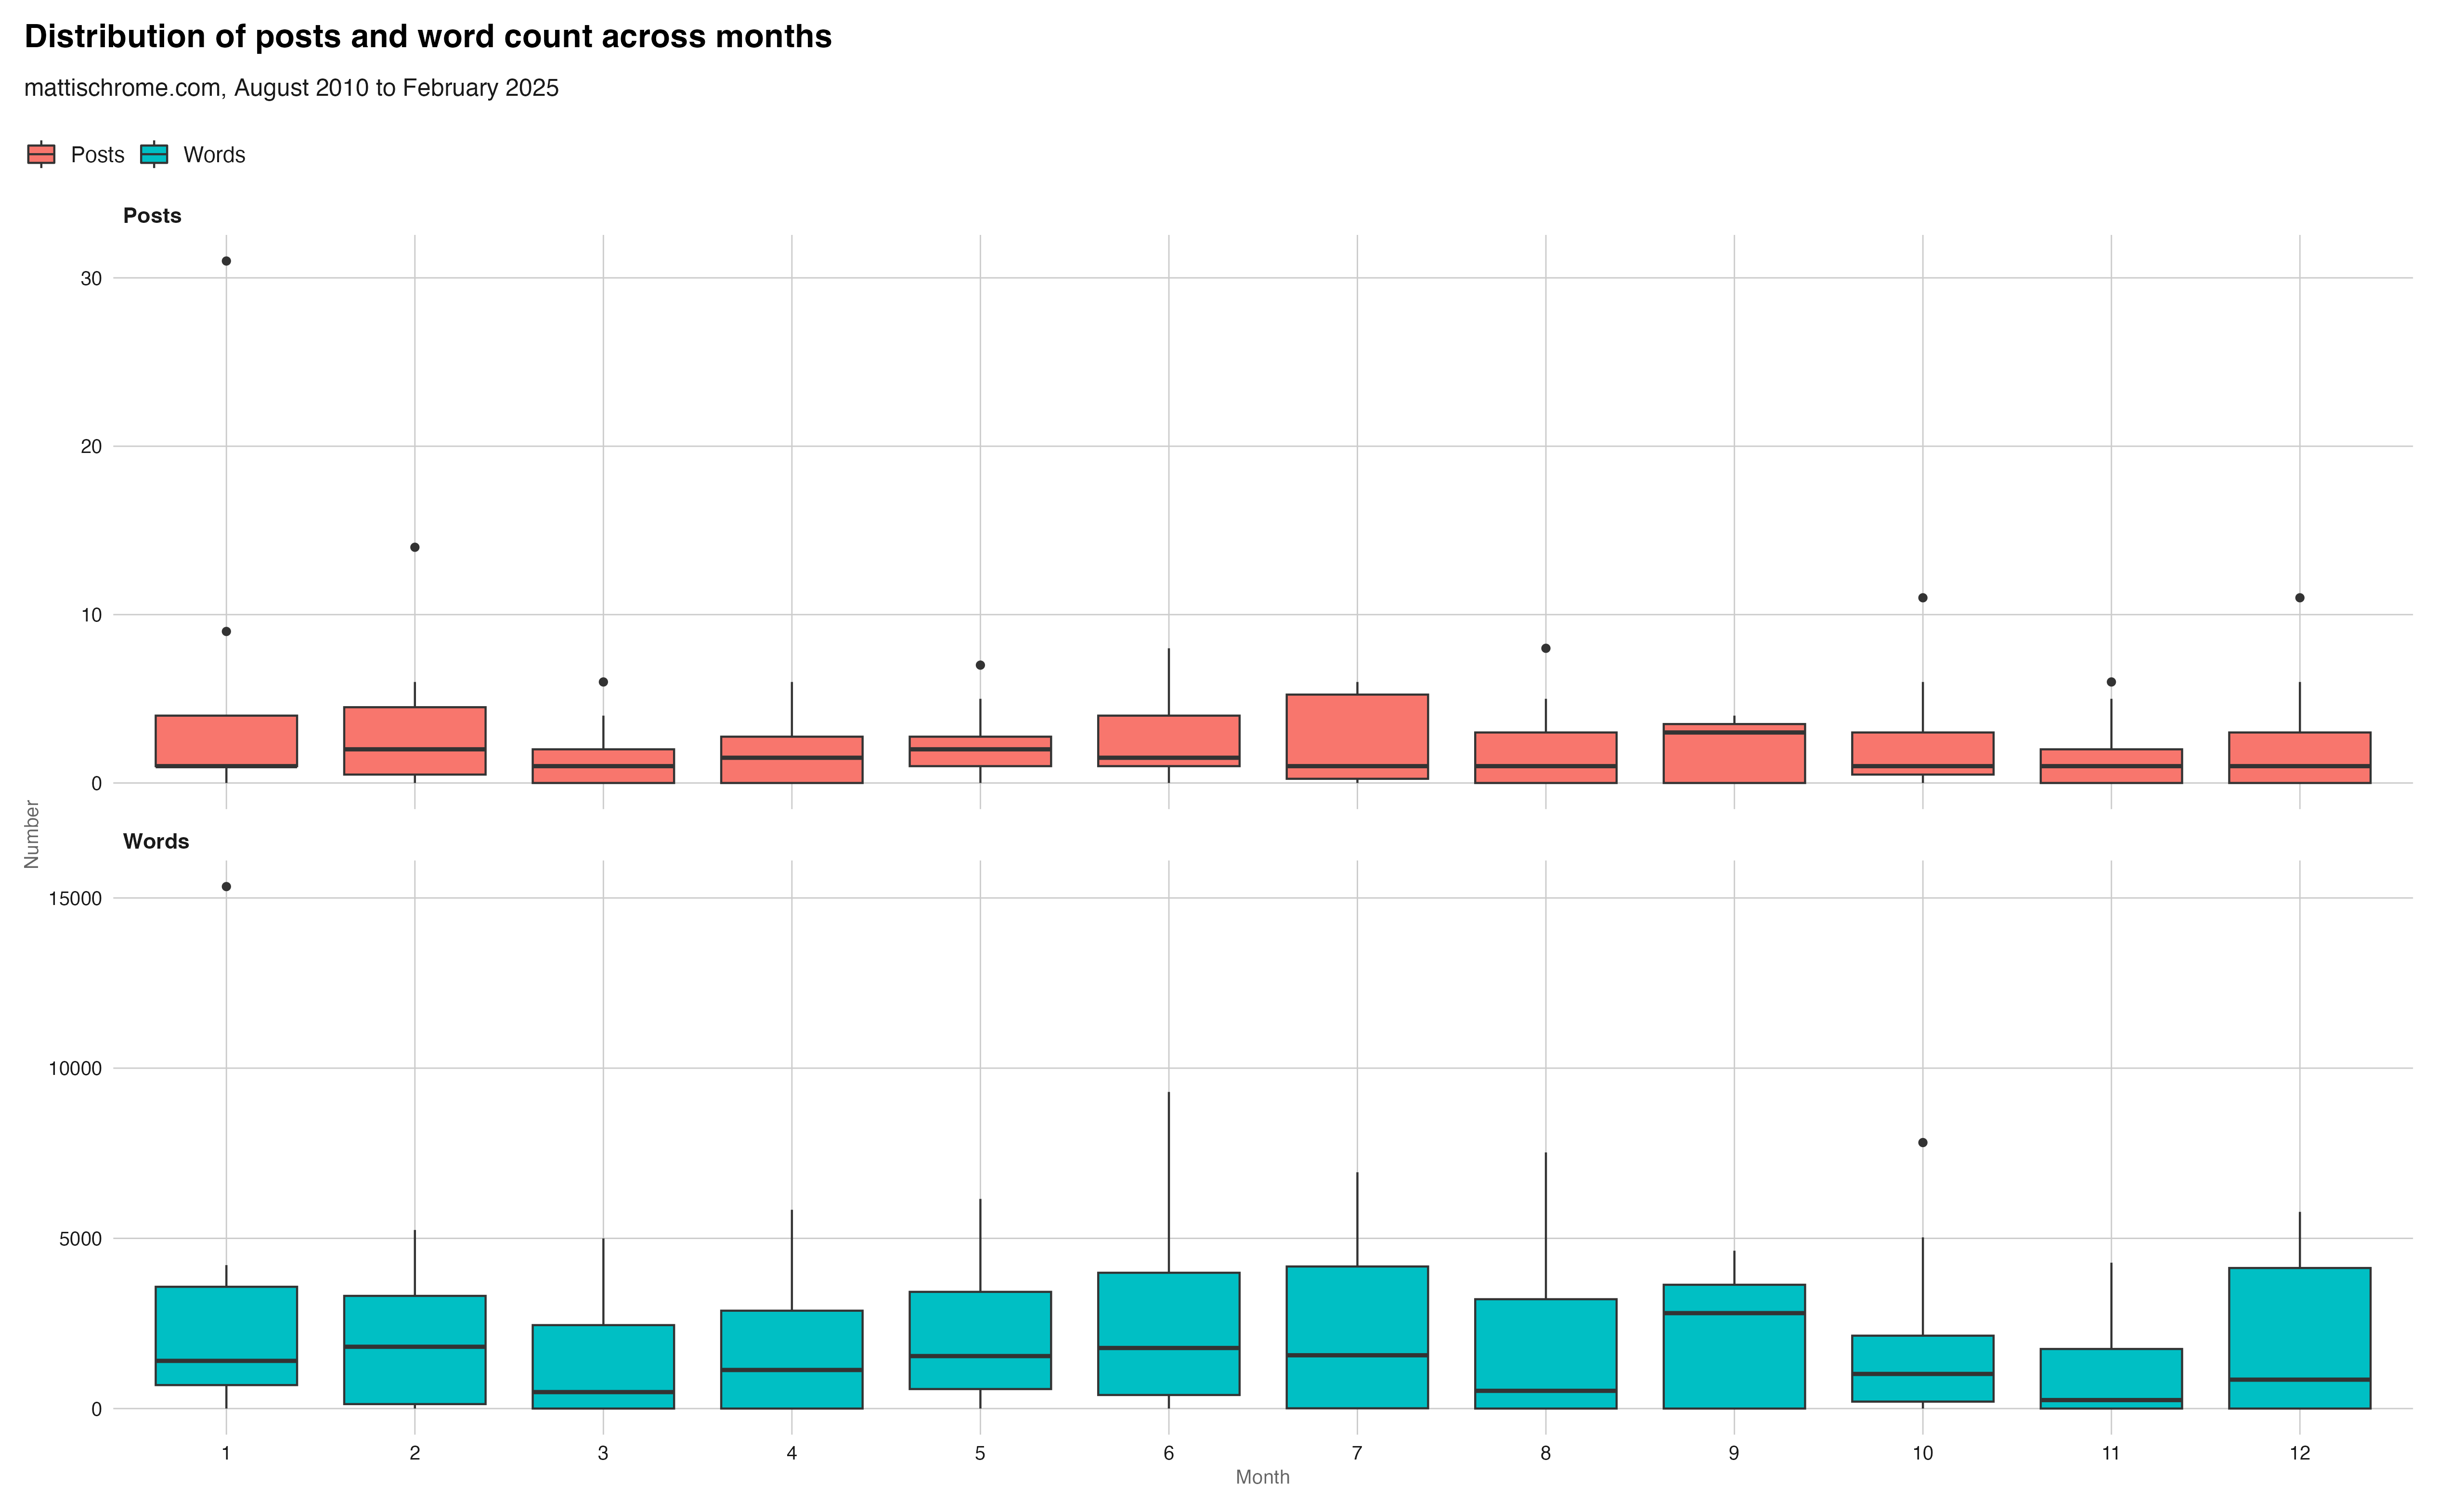
Unfortunately the box plots don’t tell you how the years contribute to the distribution, so you’ll have to take my word for it that the two January outliers are for 2024 and 2025. You only have to scroll back and count the recent posts here to notice that 2025 is the higher of the two. But if you look at the rest of the box, most other years I posted between 2 and 5 posts and half the time less than 1000 words over the whole month.
September seems to be the best month for both median number of posts and words written. It’s not surprising that the same month comes out top for both measures as they are correlated with one another. If you write lots of posts, you do write lots of words eventually!
I also have data on the category of each post, but this is inconsistently coded so I will leave it behind for now. I will try and tidy things up behind the scenes and do a deeper dive later in the year, around the 15th anniversary!
See Also
- Post Statistics
- A Collection of Links About Blogging
- All Part of the Process
- The Incredible Shrinking Blog Post
- More Uses For Little Notebooks
